
 April 2015 Queens Real Estate Market Update
Homes sales increased in March while inventory levels remained tight. Inventory typically reaches its low point during the winter months, but the current level is well below that of last year. This led to higher than expected home price increases. While home price gains are good for homeowners, it will be important for inventory to loosen in the coming months to avoid constraining home sales and driving down affordability ahead of the potential for rising interest rates.
Month’s Supply: 6.1 Months
Last Month: 5.7 Months
Last year: 7.5 Months
Interest Rates
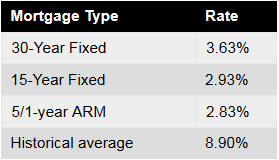
 30-year rates remain below 4% but have begun to trend back upward after dropping in the second half of last year amid concerns around the global economy. Currently, Freddie Mac reports the following figures: 30-year fixed rate, 3.78%; 15-year fixed rate, 3.06%; 5/1-year adjustable rate, 2.97%.
Queens Home Sales
 The seasonally adjusted annualized rate of Queens home sales increased 9.8% from February to March to a pace of 641 homes. Queens home sales decreased year-on-year in March and were 2.3% lower than the same month of the previous year. Specifically, Queens Residential single and multi family home sales are down .6%, Queens Condo sales are up 18.8%, and Queens Coop sales are down 10.4% from the same month last year.
Queens Home Prices
 The median Queens home price reported by the Long Island Board of Realtors increased 1.3% in March to $405,000. Prices remain 9.5% higher than the same month of the previous year. The recent uptick in year-over-year price growth is probably due to low inventory levels across the county in recent months. Specifically, Queens Residential single and multi family home prices are up 6.3%, Queens Condo prices are up 16.7%, and Queens Coop prices are up 3.4% from the same month last year.
Queens Housing Inventory
The number of homes available decreased 26.2% compared to the same month of the previous year, with 4,084 Queens homes available for sale in March. This translated to 6.1 months of supply. Historically, inventory typically remains low during March due to the cool weather and then loosens as the weather warms in April. Specifically, there are currently 2,574 Residential single and multi family homes, 1,300 Coops, and 405 Condos available for sale in Queens County.
 Courtesy of George & Abigail Herrera w/the Queens Home Team at Keller Williams Realty Landmark II.
BUY: www.exclusivequeenshomes.com | SELL: www.queenshomeselling.com


 30-year rates remain below 4% after dipping last month due to concern surrounding the global economy and Europe. Currently, Freddie Mac reports the following figures: 30-year fixed rate, 3.99%; 15-year fixed rate, 3.17%; 5/1-year adjustable rate, 3.01%.


 30-year rates increased 13 basis points from the same week of the previous month, showing the first significant movement in rates in recent months. Currently, Freddie Mac reports the following figures: 30-year fixed rate, 4.23%; 15-year fixed rate, 3.37%; 5/1-year adjustable rate, 3.06%.


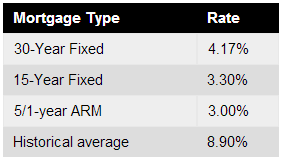 30-year rates rose a mere 3 basis points from the same week of the previous month, continuing this year’s streak of relatively flat and occasionally falling mortgage rates. Currently, Freddie Mac reports the following figures: 30-year fixed rate, 4.17%; 15-year fixed rate, 3.30%; 5/1-year adjustable rate, 3.00%.

